 By Md Arif Ahamed
Quick summary: Learn how to read STR reports: understand occupancy, ADR, RevPAR and the MPI, ARI and RGI indexes, with a worked example and a monthly review routine.
Learning how to read STR reports comes down to three questions: how is my hotel performing, how is my competitive set performing, and what is the gap between us? STR reports answer these with occupancy, ADR and RevPAR for your hotel and your competitors, plus three index numbers (MPI, ARI and RGI) that show your share of the market.
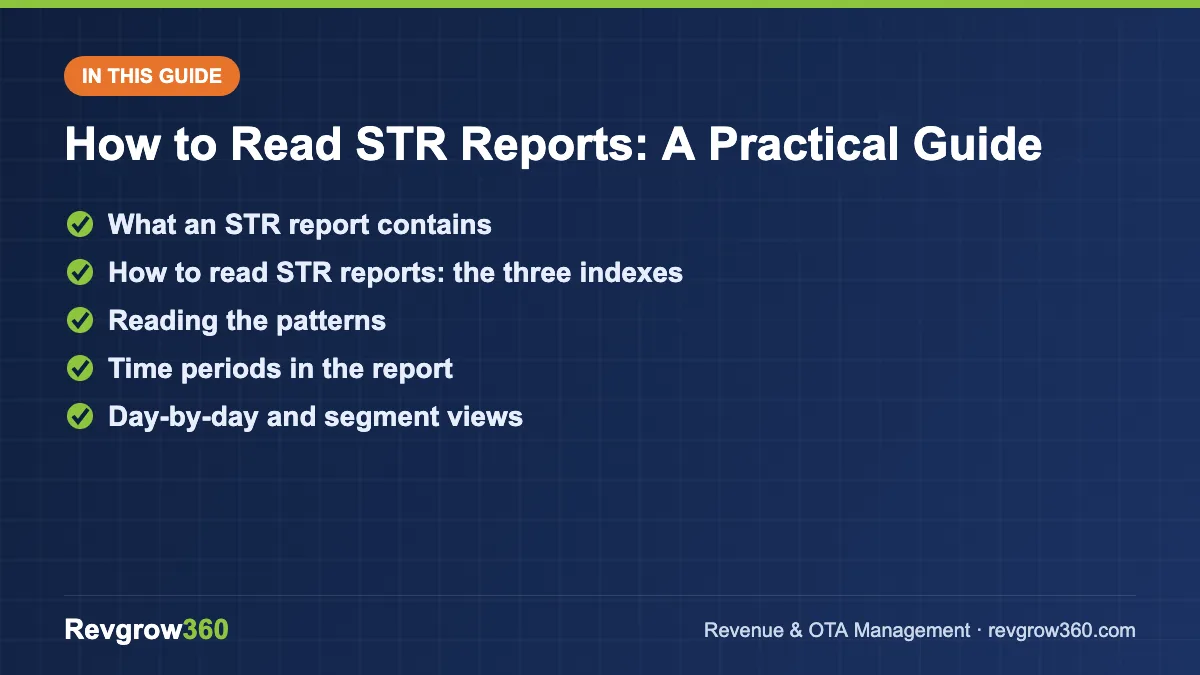
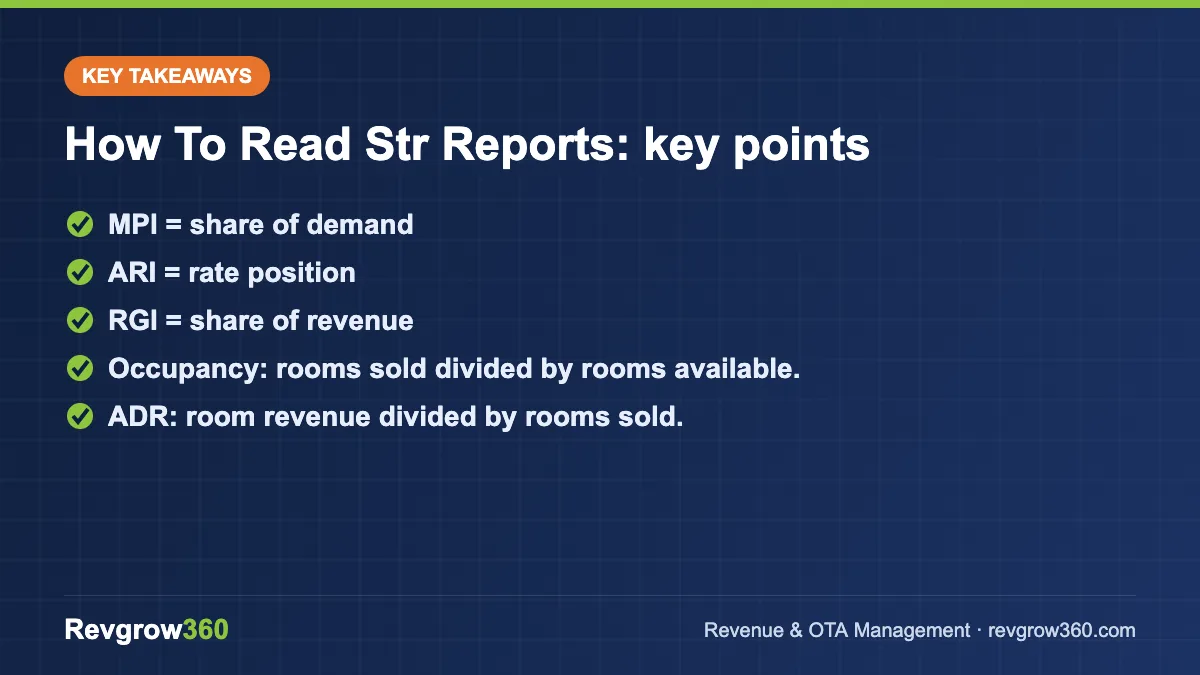
- MPI = share of demand
- ARI = rate position
- RGI = share of revenue
The reports look dense at first, but once you know the layout they take ten minutes to read. This guide explains each section, shows how to interpret the indexes with a worked example, and lists the actions each pattern should trigger. Figures are hypothetical, for a 50-room hotel in Pune.
STR is a hospitality benchmarking provider; you can find official information about its products at str.com. Report layouts and names change over time, so use this article as a reading framework and check your own report’s legend.
What an STR report contains
A typical hotel benchmarking report compares your property against a competitive set, which is a group of hotels you select (and the provider approves) as your true rivals. The data is anonymised: you see the set’s combined performance, not each competitor’s individual numbers.
The core metrics are:
- Occupancy: rooms sold divided by rooms available.
- ADR: room revenue divided by rooms sold.
- RevPAR: room revenue divided by rooms available, or occupancy multiplied by ADR.
Each is shown for your hotel, for the competitive set, and as an index. Read our basics on RevPAR, ADR and occupancy rate if any of these are new.
How to read STR reports: the three indexes
The indexes are the heart of the report. Each compares your hotel to the set average, where 100 means you are exactly at par.
| Index | Full name | Formula | What it shows |
|---|---|---|---|
| MPI | Market Penetration Index (occupancy index) | Your occupancy / set occupancy x 100 | Your share of demand |
| ARI | Average Rate Index | Your ADR / set ADR x 100 | Your pricing power |
| RGI | Revenue Generation Index (RevPAR index) | Your RevPAR / set RevPAR x 100 | Your overall revenue share |
Worked example
| Metric | Your hotel | Competitive set | Index |
|---|---|---|---|
| Occupancy | 72% | 68% | MPI = 105.9 |
| ADR | ₹4,000 | ₹4,400 | ARI = 90.9 |
| RevPAR | ₹2,880 | ₹2,992 | RGI = 96.3 |
Your hotel is winning on volume (MPI above 100) but selling cheaper than the set (ARI below 100). Overall you capture slightly less than your fair share of revenue (RGI below 100). The likely action is to raise rate on high-demand dates, since you are already filling more rooms than competitors.
Reading the patterns
| Pattern | Meaning | Typical action |
|---|---|---|
| MPI above 100, ARI below 100 | You buy occupancy with price | Test higher rates on strong days |
| MPI below 100, ARI above 100 | You hold rate but lose volume | Check visibility, reviews and restrictions |
| Both above 100 | You outperform the set | Protect position, keep testing rate |
| Both below 100 | You lag on every front | Review product, reputation, distribution, then price |
Do not chase 100 on everything. A luxury boutique may deliberately run an ARI well above 100 and a lower MPI. The question is whether the combination gives an RGI that matches your strategy.
Time periods in the report
Reports usually show the current day, week and month, plus the same periods last year, a running average and year-to-date. Read them in this order:
- Month and year-to-date indexes: your overall position.
- Last week and last four weeks: current momentum.
- Same period last year: are you improving or falling?
- Day of week: which days win or lose share.
Day-of-week analysis is often the most valuable. A hotel may have a strong RGI on weekends but a weak one midweek, which points to a corporate or midweek offer rather than a general price cut.
Day-by-day and segment views
Daily data lets you match results to events. If your RGI drops on a festival date, check whether your rate was too low early, whether you sold out too soon, or whether competitors released rooms later at higher prices. Some reports also show a segment or channel breakdown for your own hotel, and you can compare it against your own booking data to see which channels drive your share.
Link this reading with your pricing approach in our guide to hotel dynamic pricing strategy.
Step-by-step: monthly STR review
- Confirm your competitive set is still correct and data submission is complete.
- Record occupancy, ADR, RevPAR and the three indexes for the month.
- Compare against the previous month and the same month last year.
- Break results down by day of week and find the two weakest days.
- Read the set’s performance trend. Is the whole market up or down?
- Separate market effect from your own effect: if you fell but the market fell more, your index rose.
- Write three actions with an owner and deadline.
- Check the result next month.
Common mistakes when reading STR reports
- Looking only at your own numbers. A 70 percent occupancy month may be poor if the set is at 80.
- Treating index changes as always your fault. A competitor’s renovation or closure can move the set average.
- Ignoring the quality of the competitive set. A set made of mismatched hotels gives misleading indexes. See our guide on how to choose a competitive set.
- Reading monthly averages only. Weekly and daily data reveal timing problems.
- Chasing RGI by discounting. Raising occupancy at any price can lift MPI while damaging profit.
- Skipping action. A report without a decision is just a file.
Combining STR data with your own data
Benchmarking tells you the what; your own records tell you the why. Add your channel mix, lead time, cancellation rate and review scores to explain index movement. For example, if MPI falls while OTA ranking drops, read our guide to improving hotel ranking on OTAs. If ARI falls while you run many promotions, review the promotion calendar.
If you do not subscribe to benchmarking reports, you can still approximate a market view by tracking competitor rates and review scores manually, though this is not a substitute for actual market occupancy data.
Second worked example: reading a weak weekday
Imagine the same Pune hotel’s report shows these figures for Tuesdays across the month.
| Metric | Your hotel | Competitive set | Index |
|---|---|---|---|
| Occupancy | 48% | 62% | MPI = 77.4 |
| ADR | ₹3,700 | ₹3,900 | ARI = 94.9 |
| RevPAR | ₹1,776 | ₹2,418 | RGI = 73.4 |
Here both indexes are below 100, and the occupancy gap is the larger problem. The hotel is neither cheap nor full on Tuesdays. Possible causes include a weak corporate pipeline, high minimum-stay restrictions on midweek nights, or poor OTA visibility on weekday searches. A sensible first test is to remove restrictions, check midweek ranking on the main OTAs, and approach local companies with a negotiated midweek rate. Do not simply cut price across the board; fix the demand source first.
Questions to ask every time you open the report
- Is the whole market growing or shrinking, and are we moving with it?
- Which days of the week hold our best and worst indexes?
- Did any competitor open, close or renovate this period?
- Did we run a promotion, change rates or lose OTA ranking?
- Are we leaving money on the table on sold-out days?
Sharing the report with your team
Keep the report from becoming a document only the owner reads. Share a one-page summary with the front office manager, sales lead and revenue analyst each month. Show the three indexes, the weakest day of the week and the actions agreed. When the whole team sees the same numbers, discussions about price and promotions become far more practical.
Key takeaways
- STR-style reports compare your occupancy, ADR and RevPAR to a competitive set.
- MPI shows volume share, ARI shows rate position and RGI shows total revenue share; 100 is par.
- Read month, year-to-date, recent weeks and day of week, in that order.
- Separate market movement from your own performance before taking action.
- Always end the review with owned, dated actions.
If you want a second pair of eyes on your benchmarking and pricing, the team at Revgrow360 offers a free hotel audit through our contact page.
Frequently asked questions
What does an RGI of 100 mean in an STR report?
An RGI of 100 means your RevPAR equals the average RevPAR of your competitive set, so you capture exactly your fair share of revenue. Above 100 means you outperform the set, and below 100 means you are capturing less than your fair share.
What is the difference between MPI and ARI?
MPI compares your occupancy to the competitive set and shows your share of demand. ARI compares your ADR to the set and shows your rate position. Together they explain whether you win through volume, price or both, which determines your RGI.
How often should I review an STR report?
Review the monthly report in detail, glance at weekly data for momentum, and check daily data around festivals or events. A short weekly look plus a structured monthly review with owned actions is enough for most independent hotels.
Why is my index low even when my occupancy is high?
If your occupancy is high but your competitive set is even higher, your MPI may still be below 100. A low ARI can also drag RGI down. Compare both indexes, and check whether discounts or channel mix are holding your rate below the set.
More Revenue Management guides
Hotel Revenue Forecasting in Excel: A Practical Guide
Build a simple Excel workbook that combines history and on-the-books bookings to forecast rooms, ADR and revenue, then measure accuracy.
How to Build a Hotel Budget: A Practical Guide
A step-by-step method to build a hotel budget that starts with revenue, adds realistic costs and gets reviewed every month.
OTA Commission Rates for Hotels Explained
What hotels really pay OTAs once programmes, promotions and taxes are added, with typical commission ranges and practical ways to reduce OTA…
Revenue Management for Boutique Hotels: A Practical Guide
A practical guide to pricing and distribution for small, distinctive hotels, including room-type pricing, restrictions, channels and a weekly checklist.
Short Term Rental KPIs: 10 Metrics with Formulas
The 10 short term rental KPIs every host should track, each with a formula and a worked example, plus how to set…
Airbnb Income and Expense Tracking: A Simple System
Learn what to record for every booking and expense, how payouts differ from gross revenue, which categories to use and a monthly…