 By Md Arif Ahamed
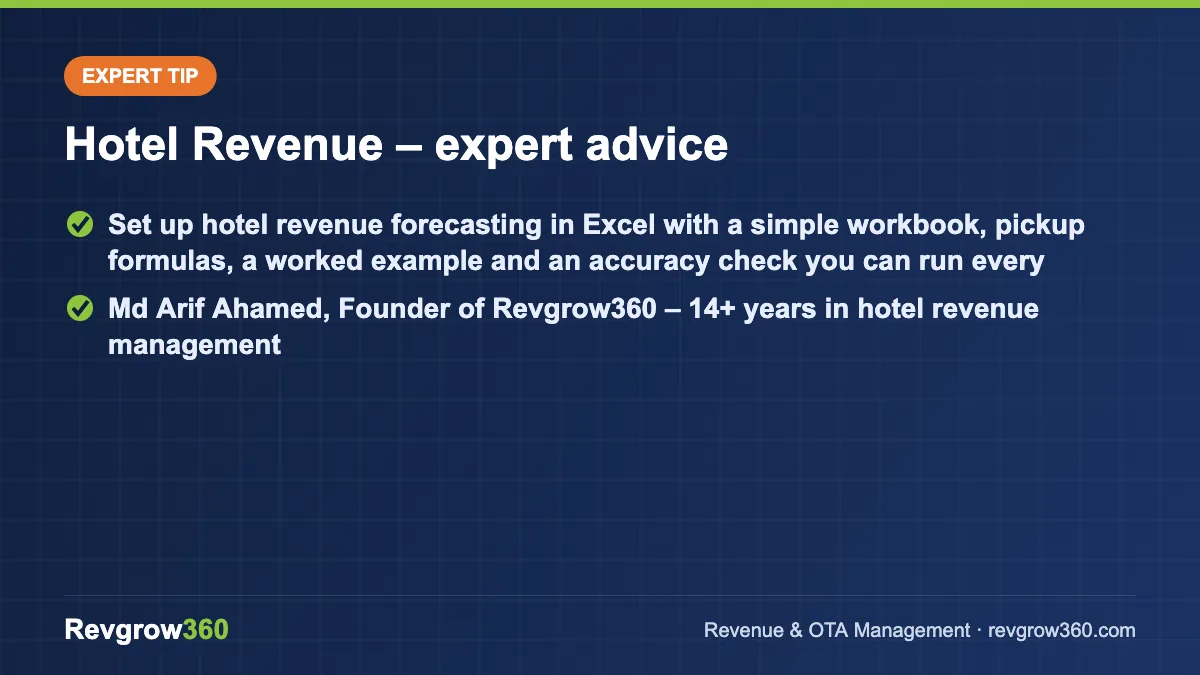
Quick summary: Set up hotel revenue forecasting in Excel with a simple workbook, pickup formulas, a worked example and an accuracy check you can run every week.
Hotel revenue forecasting in Excel means using a structured spreadsheet to predict future rooms sold, ADR and room revenue from your historical data and your current bookings. You do not need expensive software to start. A clean workbook with a data tab, a pace tab and a forecast tab can give a small hotel a forecast that is far better than guessing.
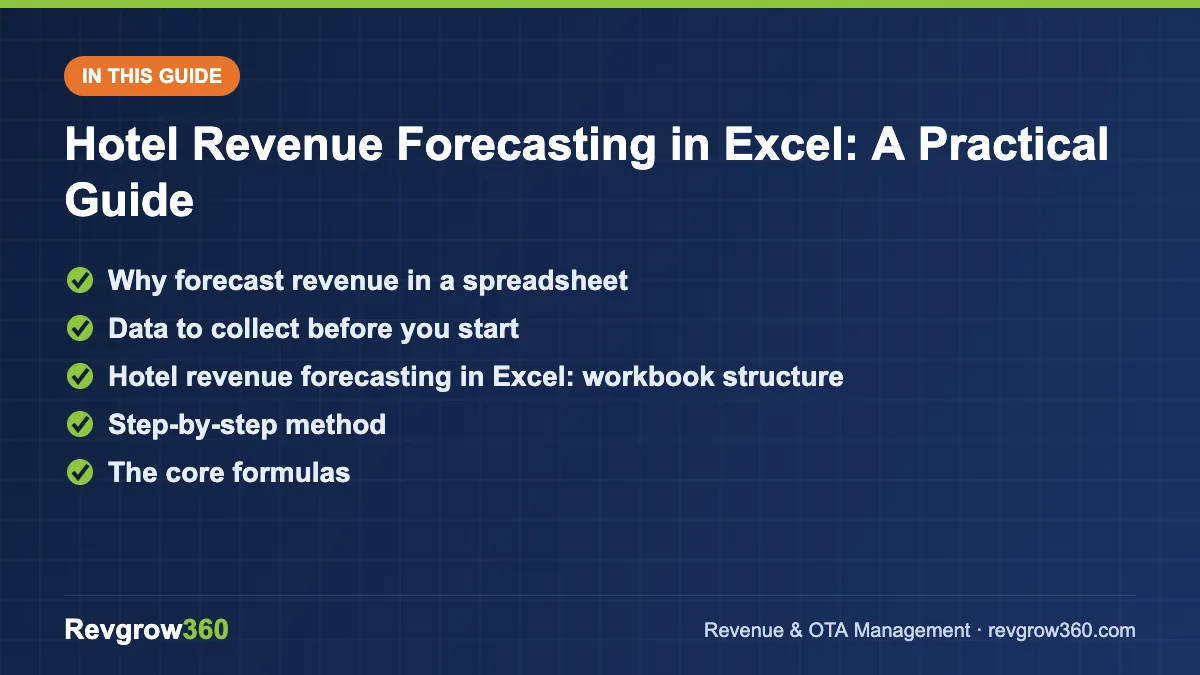
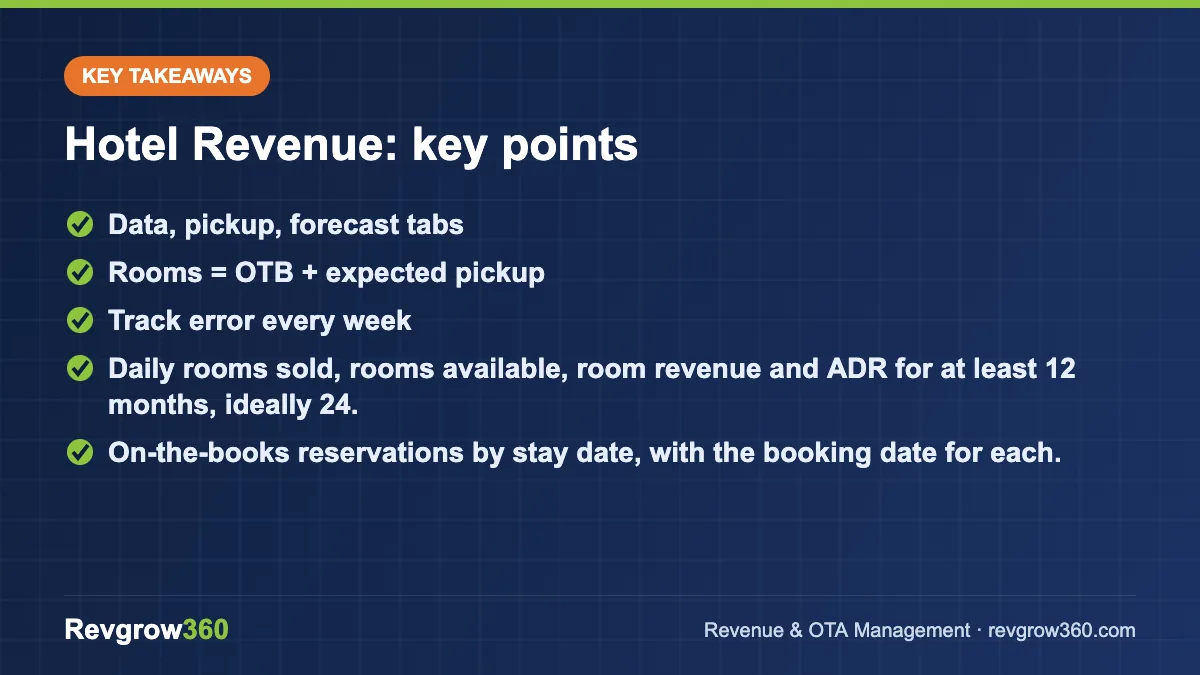
- Data, pickup, forecast tabs
- Rooms = OTB + expected pickup
- Track error every week
This guide shows how to set up that workbook, which formulas to use, how to combine history with on-the-books data, and how to measure whether your forecast is any good. Examples are hypothetical, for a 30-room hotel in Jaipur.
Why forecast revenue in a spreadsheet
A forecast tells you what is likely to happen so you can act before it does. If you see that next Saturday is pacing 20 rooms behind last year, you can adjust price or open a channel. If you see a strong month, you can raise rates and close discounted rates early.
Excel is flexible, cheap and understood by everyone on your team. Its weakness is manual upkeep, so the discipline is in keeping the workbook simple. For the principles behind forecasting, read our hotel demand forecasting guide.
Forecast occupancy from bookings on hand.
Data to collect before you start
- Daily rooms sold, rooms available, room revenue and ADR for at least 12 months, ideally 24.
- On-the-books reservations by stay date, with the booking date for each.
- Channel split: direct, OTA, corporate, group.
- A calendar of events, festivals, holidays and wedding dates.
- Rate changes you made, so you can separate rate effects from demand.
Export these from your PMS or channel manager as CSV files and paste them into a data tab. Never type over raw data; keep it untouched and build formulas on a separate tab.
Hotel revenue forecasting in Excel: workbook structure
| Tab | Purpose | Key columns |
|---|---|---|
| Data | Daily history from PMS | Date, rooms sold, available, revenue |
| Calendar | Events and day types | Date, day of week, event, season |
| Pickup | On-the-books by stay date | Stay date, rooms booked today, rooms booked same day last year |
| Forecast | Daily projection | Date, forecast occupancy, ADR, revenue |
| Accuracy | Forecast versus actual | Date, forecast, actual, error |
Step-by-step method
- Clean the data. Remove complimentary rooms and out-of-order rooms from available inventory, and flag unusual days such as a power failure or a one-off group.
- Add day-type flags. Use a column for weekday, weekend, festival or peak. Use WEEKDAY() for day of the week and a lookup to your event calendar.
- Calculate baseline occupancy. Use AVERAGEIFS to average occupancy for the same month and day type over past years.
- Calculate on-the-books. Use SUMIFS to total confirmed rooms for each future stay date.
- Estimate pickup. Compare how many rooms were typically added between today’s lead time and arrival in earlier years, and add that to the current booking count.
- Apply adjustments. Increase or decrease for events, new competitors or rate changes.
- Convert to revenue. Multiply forecast rooms by forecast ADR.
- Track accuracy. Each week compare forecast with actual and record the error.
The core formulas
- Occupancy: rooms sold divided by rooms available.
- ADR: room revenue divided by rooms sold.
- Forecast rooms = on-the-books rooms + expected pickup.
- Expected pickup = average of the rooms added at the same lead time in past comparable periods.
- Forecast room revenue = forecast rooms x forecast ADR.
In Excel, for example, expected pickup for a stay date can be an AVERAGEIFS over past rows with the same day type and lead time. Keep each formula on its own column so a colleague can audit it.
Worked example
A 30-room hotel in Jaipur wants to forecast Saturday, 14 February. Today is 14 days before arrival.
| Item | Value |
|---|---|
| Rooms on the books today | 16 |
| Average rooms added in the final 14 days, comparable Saturdays | 9 |
| Forecast rooms sold | 25 |
| Forecast occupancy | 25 / 30 = 83% |
| Forecast ADR | ₹5,400 |
| Forecast room revenue | 25 x ₹5,400 = ₹1,35,000 |
Because the forecast is 83 percent two weeks out, the revenue manager might raise the rate or remove the cheapest discount. If it were 55 percent, the response would be a targeted offer. Pricing actions are covered in our hotel dynamic pricing strategy article.
Forecast horizons
| Horizon | Method | Use |
|---|---|---|
| 0-30 days | On-the-books plus pickup | Daily pricing decisions |
| 1-6 months | Pace versus last year plus events | Promotions, staffing |
| 6-12 months | Seasonal history with trend | Budget, major campaigns |
Measuring accuracy
Calculate the error for each day: (forecast minus actual) divided by actual. Then average the absolute errors over a month to get a simple accuracy score. Many hotels aim for a smaller error close in and accept larger error far out. The point is trend: if the error shrinks as you refine the model, it works.
Review the biggest misses. Was there a cancellation wave, a late group, or a rate change? Record the reason in the sheet so the model learns.
Forecasting by channel and segment
A total-rooms forecast hides useful detail. Once the basic sheet works, split it by segment so you can see where demand is coming from and where it is weak.
| Segment | Typical booking window | Forecast approach |
|---|---|---|
| Leisure OTA | Short to medium, strongly seasonal | Pickup curves by day type |
| Direct and repeat | Varies, often last minute | Trend plus campaign calendar |
| Corporate | Short, midweek heavy | Account-level expectation from sales team |
| Groups and weddings | Long, contract based | Confirmed blocks, with a wash allowance |
For groups, apply a cautious wash factor to contracted rooms, because not every blocked room is eventually used. Our glossary on hotel overbooking strategy covers how cancellations and no-shows affect the numbers.
Useful Excel functions for hotel forecasts
- SUMIFS and COUNTIFS: total rooms and bookings by stay date, channel or segment.
- AVERAGEIFS: baseline occupancy or pickup by month and day type.
- XLOOKUP or VLOOKUP: bring event flags from your calendar tab into the forecast tab.
- EOMONTH and WEEKDAY: build monthly summaries and day-of-week flags.
- Pivot tables: summarise history by month, day type and channel in seconds.
- Conditional formatting: highlight dates where the forecast is below or above a threshold so the daily review takes minutes.
A weekly forecasting routine
- Monday: refresh data from the PMS and channel manager.
- Review the next 30 days and flag dates that are well ahead of or behind last year.
- Check the event calendar for new festivals, matches, conferences or weddings.
- Decide rate, restriction or promotion actions for flagged dates.
- Record the forecast in the accuracy tab before the dates arrive.
- Friday: compare the week’s actuals to the forecast and note the reasons for large misses.
This takes under an hour once the workbook is set up, and it builds a habit that is more valuable than any single formula. Revenue managers can apply the same routine described in our hotel revenue management guide.
Common mistakes
- Using last year’s number without removing one-off events.
- Mixing out-of-order rooms into available inventory.
- Ignoring cancellations; forecast net, not gross, bookings.
- Forecasting only monthly totals instead of daily.
- Overwriting history with formulas that cannot be traced.
- Never recording accuracy, so errors repeat.
Handling special dates and unusual events
Festivals, weddings, cricket matches and conferences break normal patterns. Mark each one in your calendar tab with a simple code and note what happened to occupancy and ADR on that date. After two or three years you will have a library of event effects you can apply with confidence. Where the date moves each year, such as lunar-calendar festivals, record the actual date every year rather than assuming the same calendar day.
Treat one-off disruptions differently. A flood, strike or power outage should be flagged and excluded from your baseline so it does not distort the next forecast.
Tips to keep it manageable
- Update the pickup tab at a fixed time every morning.
- Use data validation lists for day type and event flags.
- Protect formula columns so staff do not overwrite them.
- Save a dated copy each month for audit.
- Link your forecast to your hotel KPIs dashboard so decisions use the same numbers.
Key takeaways
- A simple Excel workbook with data, calendar, pickup, forecast and accuracy tabs is enough to start.
- Forecast rooms equal on-the-books rooms plus expected pickup.
- Forecast daily near-term and monthly further out.
- Track error every week and learn from the largest misses.
- Act on the forecast: price, restrictions and promotions should respond to it.
If you would rather have experts build and run the forecast with you, explore Revgrow360 revenue management or book a free consultation.
For more background, see this revenue management overview on Wikipedia.
Frequently asked questions
Can a small hotel forecast revenue in Excel?
Yes. A small hotel needs only daily history from its PMS, an events calendar and a pickup tab. With basic formulas such as SUMIFS and AVERAGEIFS you can forecast rooms sold and revenue, and refine the sheet as you learn which assumptions work.
What is pickup in hotel forecasting?
Pickup is the number of rooms booked between a given point before arrival and the arrival date. By averaging pickup from comparable past periods and adding it to current on-the-books rooms, you estimate how many rooms will finally be sold.
How far ahead should I forecast?
Use daily forecasts for the next 30 days to guide pricing, monthly forecasts for the next six months to guide promotions and staffing, and seasonal forecasts up to a year for budgeting. Accuracy naturally falls as the horizon lengthens.
How do I know if my forecast is accurate?
Compare forecast and actual for each day, calculate the percentage error, and average the absolute errors monthly. Track this score over time and review your biggest misses to find causes such as late groups, cancellations or unrecorded events.
More Revenue Management guides
How to Build a Hotel Budget: A Practical Guide
A step-by-step method to build a hotel budget that starts with revenue, adds realistic costs and gets reviewed every month.
OTA Commission Rates for Hotels Explained
What hotels really pay OTAs once programmes, promotions and taxes are added, with typical commission ranges and practical ways to reduce OTA…
Revenue Management for Boutique Hotels: A Practical Guide
A practical guide to pricing and distribution for small, distinctive hotels, including room-type pricing, restrictions, channels and a weekly checklist.
Short Term Rental KPIs: 10 Metrics with Formulas
The 10 short term rental KPIs every host should track, each with a formula and a worked example, plus how to set…
Airbnb Income and Expense Tracking: A Simple System
Learn what to record for every booking and expense, how payouts differ from gross revenue, which categories to use and a monthly…
Revenue Management for Resorts: A Practical Guide
How resorts can manage rates, groups, packages and non-room revenue to maximise total income per guest, with a worked example and checklist.